Chart lines
 9:41192.168.1.107
What it shows
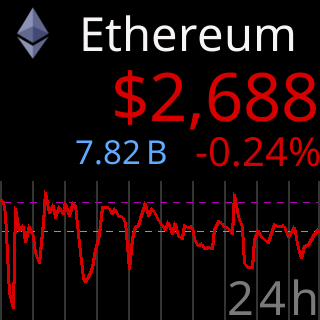
- Time divider lines: faint vertical lines splitting the chart into ten equal time slices, oldest at the left. The page’s examples:
On a 30d chart each slice is 3 days; on a 24h chart, about 2½ hours. - First/last price lines: two faint dotted horizontal lines, one at the price where the range began and one at the price now.
When the "now" line sits above the "start" line, the range is up, a companion to the line’s color.

Both are drawn even on an empty chart frame, so a (No 24h Data) chart still shows its slices.
Options
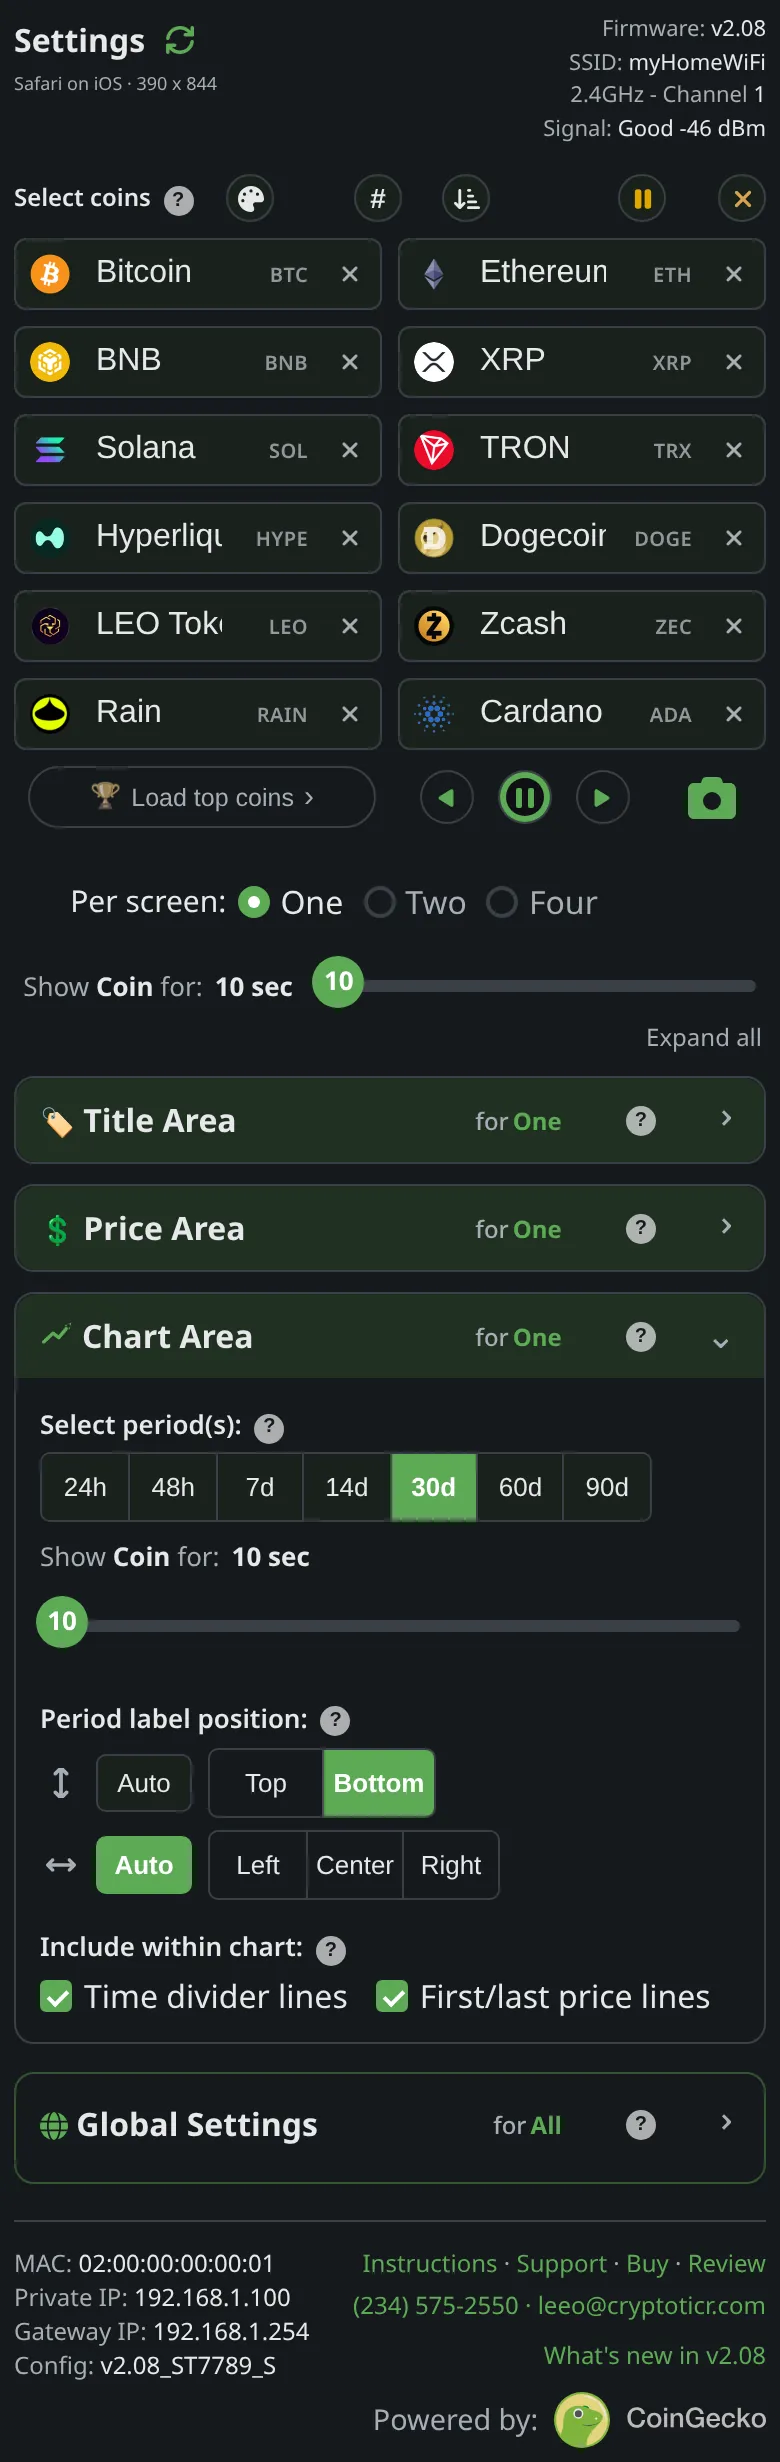
Include within chart:two switches,Time divider linesandFirst/last price lines, set per layout with the other display options.
Where to set it
Display → Chart Area → Include within chart:. Applies at once. Reference: Setting: price area and chart line switches.