Price area
 9:41192.168.1.107
What it shows
Under the big price, one row. On the right, 24h%: how far the price moved over the last 24 hours, always in the colorset’s up or down color so the color tells the direction. A move that rounds to 0.00% shows in a neutral gray instead. On the left, one of three figures, taking turns:
24h Vol: how much of the coin was traded worldwide in the last 24 hours.Market Cap: the value of all of the coin’s coins put together.Market Cap Rank: the coin’s position among all coins by that value, shown like#7.
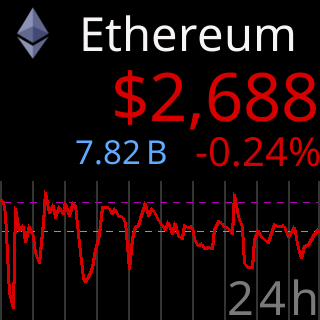
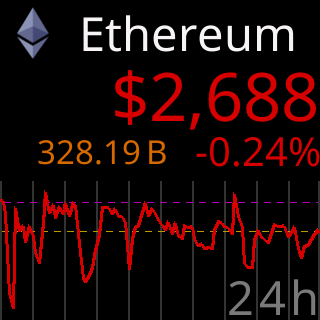
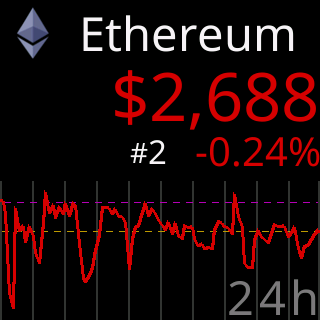
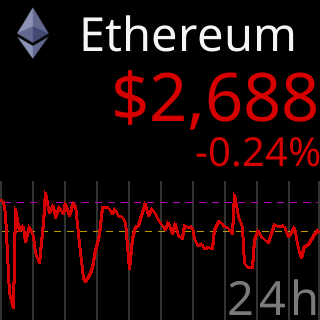
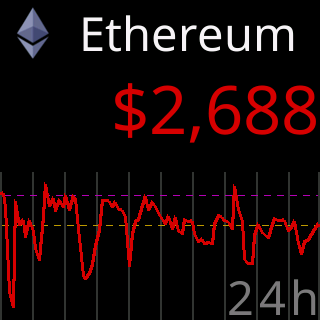
The page’s rule: Volume, Market Cap, and Rank share the left spot and take turns: the coin's screen time is split evenly among the ones you've turned on. All 24-hour figures are rolling, counting back from now, and refresh when the coin’s turn comes up. Big numbers are compact, like $1.73T. A missing figure reads No VOL, No MC or No RNK.
Two per screen draws the row smaller; Four per screen has no room for it. With every figure off, the row is gone and the chart takes the space.
Options
- Four switches:
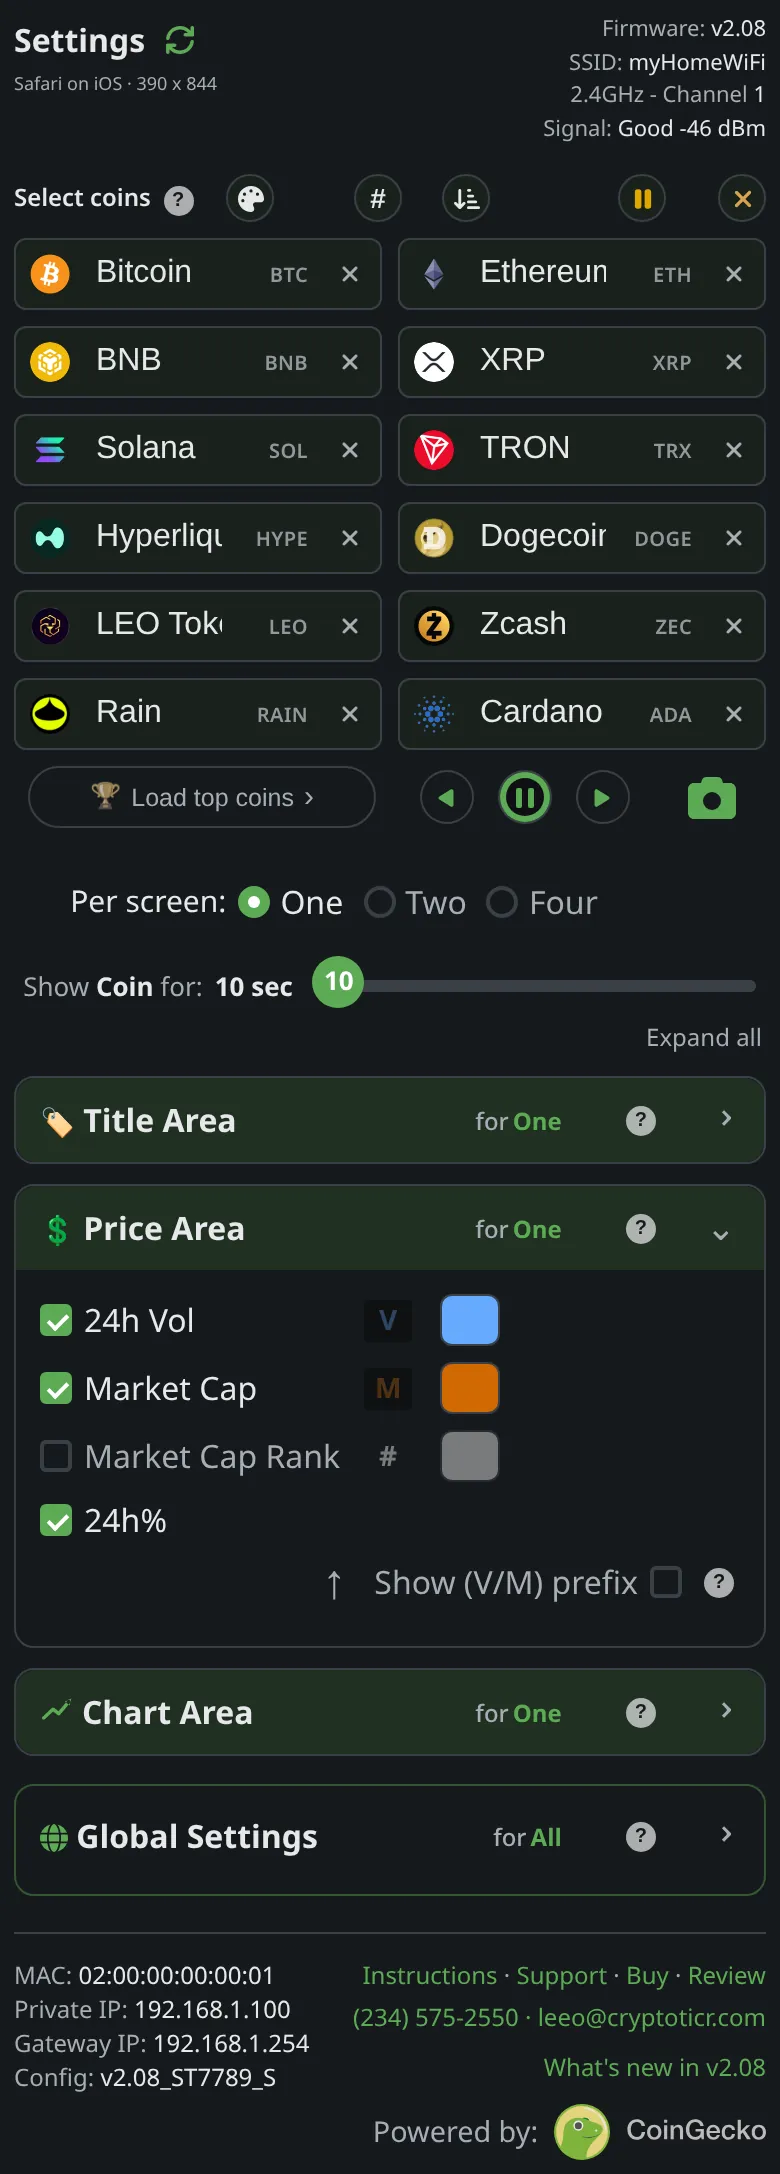
24h Vol,Market Cap,Market Cap Rank,24h%. Show (V/M) prefix: puts aVbefore the volume and anMbefore the market cap so the two can be told apart without color; rank always carries its#. Saved per colorset.- A color swatch beside each of the three left-hand figures recolors it; see Custom colors. The percentage cannot be recolored.
- Set per layout: One, Two and Four per screen each remember their own switches.
Where to set it
Display → Price Area on the settings page; changes apply at once. Reference: Setting: price area and chart line switches, Setting: V/M letters before volume and market cap.